Built to outperform the benchmark, not follow it.
Multi-Horizon · Market-Proven
Exechon Algorithm · Internal Stack
Simulated Frontier · Quarterly

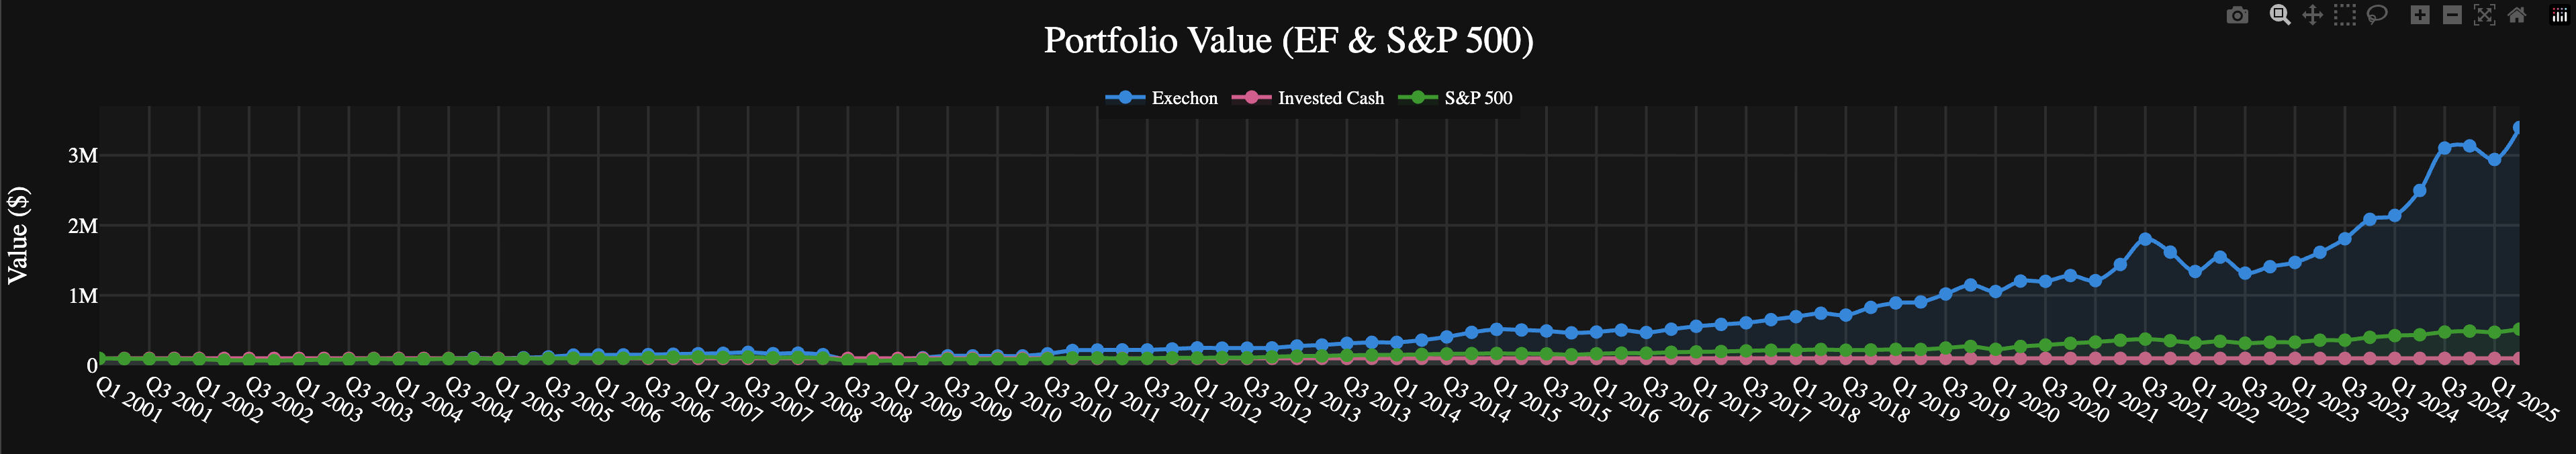
Simulated Performance (2005–2025)
Exechon Algorithm
S&P 500 (TR)
Strategy Snapshot
$100K → $3.4M in 20 Years
Initial Capital: $100,000
CAGR Uplift: +8.6% p.a.
S&P 500
$517,715
Total Return
+417.72%
CAGR
7.02%
Volatility
14.83%
Sharpe Ratio
0.32
Sortino Ratio
0.39
Max Drawdown
-47.43%
Calmar Ratio
0.15
Exechon Algorithm
$3,397,058
Total Return
+3,297.06%
CAGR
15.65%
Volatility
21.62%
Sharpe Ratio
0.65
Sortino Ratio
0.77
Max Drawdown
-57.49%
Calmar Ratio
0.27